Simulation · Lesson 4
Results and factor of safety
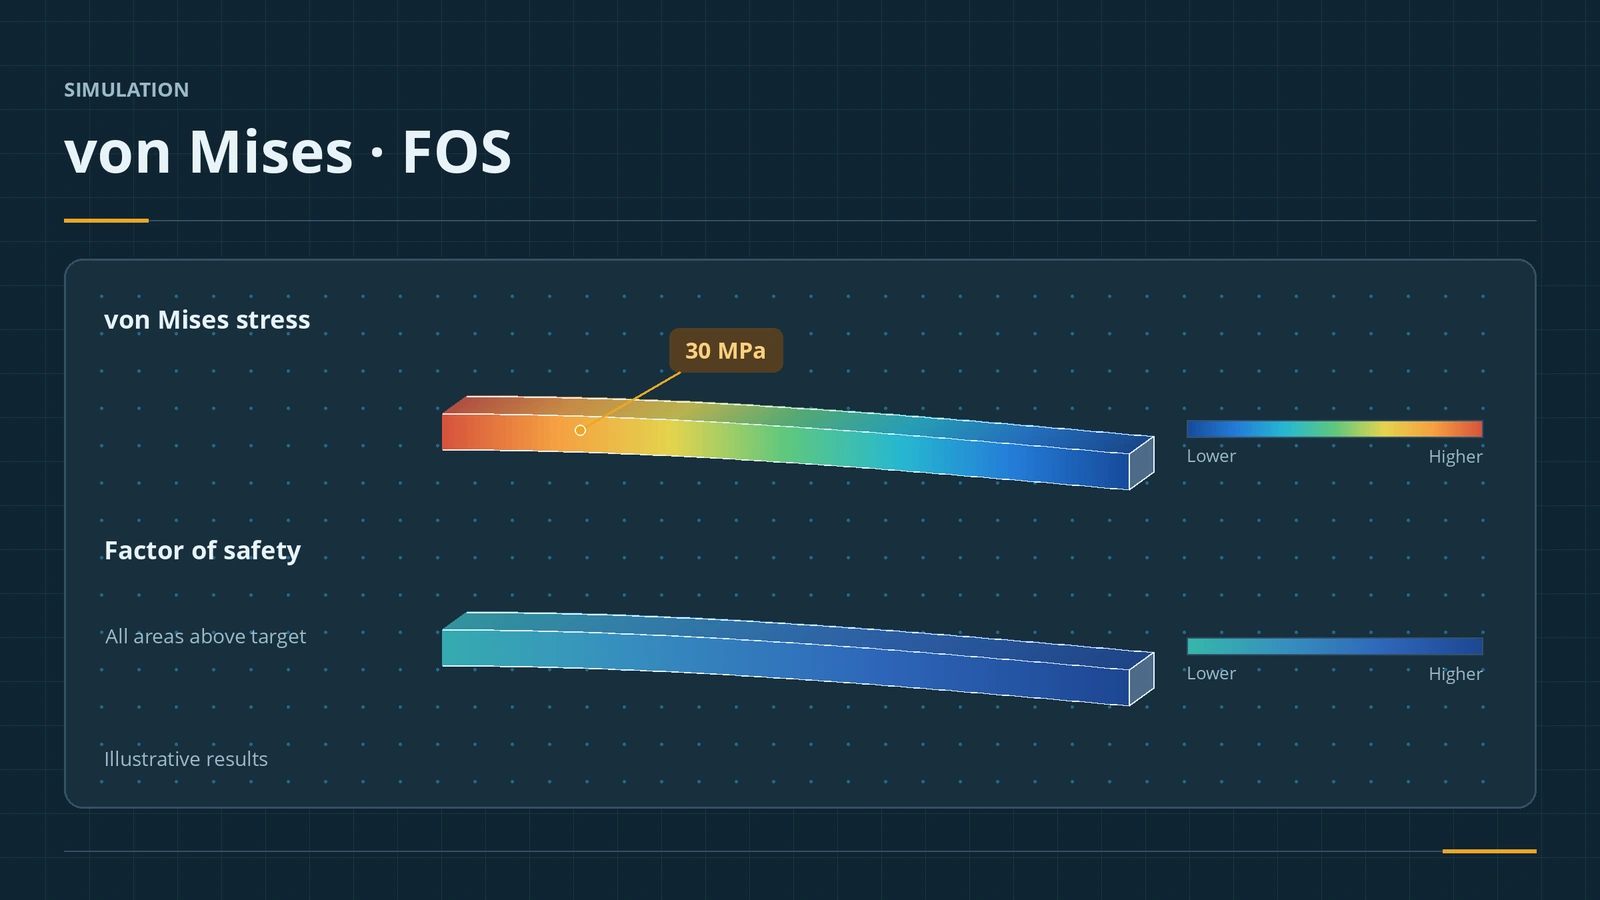
After a run, read displacement first, then von Mises stress, then the factor of safety: yield strength compared with stress. A factor above 1 passes, below 1 fails. But a red spot at a sharp corner or fixed edge is often a singularity — a number that grows with every mesh refinement and means nothing physically.
 Kevin Walsh
Where to find it
Results folder → right-click → Define Factor of Safety Plot / Probe; Simulation tab → Report
Singularities in brief
| Sign | What to do |
|---|---|
| Peak stress at a sharp internal corner | Add a fillet |
| Peak at a point load or point fixture | Spread the load over a realistic area |
| Peak at a fixed edge | Read results a short distance away |
| Peak keeps rising with every refinement | It is not a real stress — the Stress Hot Spot Diagnostic (2017–2018) can confirm it |
In one reseller test, a sensor at an L-bracket's sharp corner rose from about 110 to about 1,355 MPa over six refinements while sensors further away converged. Thermal studies show the same effect in heat flux — see thermal studies.
Step by step
-
1
Displacement, then stress
Open the displacement plot; if it is huge, check fixtures. Then the von Mises stress plot; right-click → Deformed Result to show the bent shape.
-
2
Probe away from the fixture
Right-click the stress plot → Probe, click points on the top face at mid-length. Export the values or plot them as a graph.
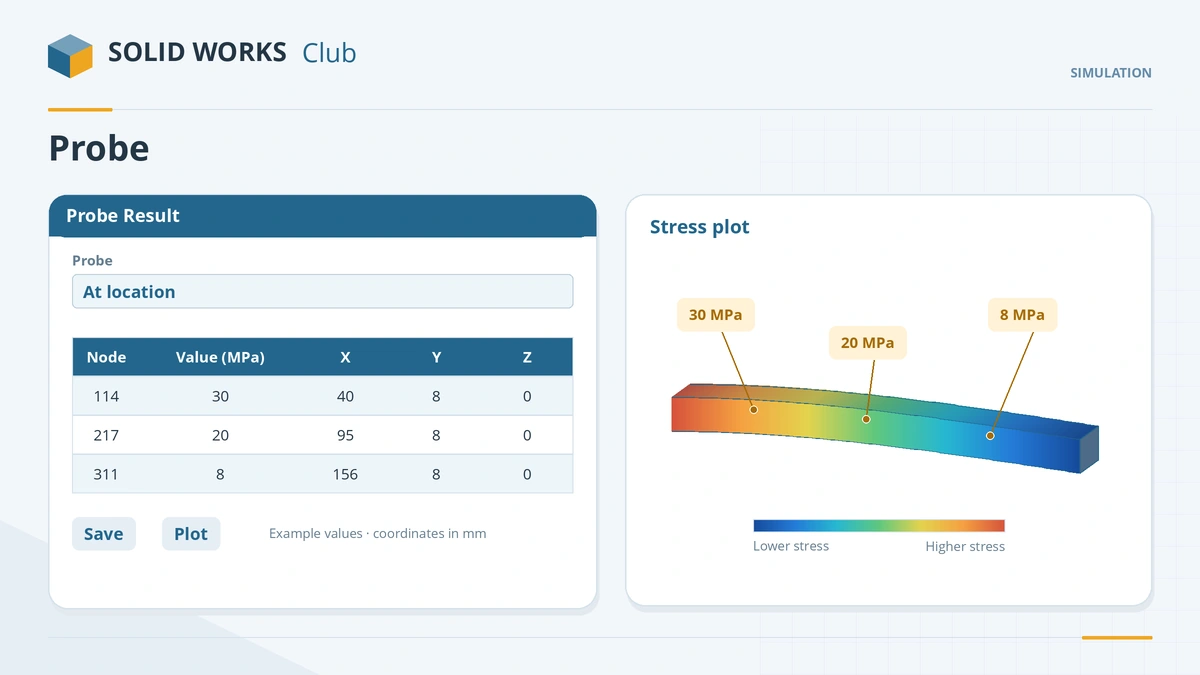
Probe stresses where they matter, away from fixtures and sharp corners. -
3
Factor of safety plot
Right-click Results → Define Factor of Safety Plot. In the last step choose Areas below factor of safety and enter your target, for example 2.
-
4
Report
Report on the Simulation tab builds a Word document with set-up and results (needs Microsoft Office).
Common mistakes
- Designing to the peak stress at a sharp re-entrant corner or fixed edge — add a fillet or read a short distance away.
- A distribution FOS plot where everything looks red — set the chart minimum to your target.
- Reading results without checking units and the deformed-shape scale.
Lesson 4 of 6 in the simulation course.
Practice
Probe the beam's top face at mid-length and run a factor of safety plot with target 2. Check: the probe reads about 30 MPa; with a yield strength of about 620 MPa (90 ksi, the alloy steel value SOLIDWORKS' blog quotes — use your material's value) the factor of safety there is about 20, so no area falls below 2.
Sources
- SOLIDWORKS Blog — Material properties in analysis (May 2012)
- Hawk Ridge — What is von Mises stress? (Feb 2022)
- Engineers Rule — Simulation essentials for SOLIDWORKS professionals (Jun 2020)
- Javelin — Factor of safety plots: areas of concern (Oct 2013)
- CATI — FOS plots on selected bodies (Apr 2013)
- Javelin — 2018 FOS plot for nonlinear static studies (Sep 2017)
- GoEngineer — How to use the Simulation probe tool (Oct 2023)
- Javelin — Simulation reports (Apr 2019)
- CATI — Simulation deformed result (Dec 2016)
- CATI — Tips for post-processing in Simulation (Apr 2021)
- Javelin — 2018 stress hot spot diagnostic (Jan 2018)
- Hawk Ridge — Accurate stress around a singularity, part 2 (Jul 2017)
- Javelin — Simulation mesh refinement (Jul 2025)
Checked November 2026. SOLID WORKS Club is independent; menu names can differ slightly between releases.
Frequently asked questions
What is the factor of safety in SOLIDWORKS Simulation?
+
It compares the material's strength with the calculated stress. Above 1 the design passes, below 1 it is expected to fail.
What is von Mises stress?
+
A single equivalent stress that combines all stress components. Compare it with the material's yield strength for ductile metals.
Why does the maximum stress keep rising when I refine the mesh?
+
It is a singularity — at a sharp corner, point load or fixed edge. Add a fillet, spread the load, or read results a little way off.
Can I plot FOS on selected bodies only?
+
Yes, since Simulation 2013. Since 2018, nonlinear studies also have a FOS plot.
Related
- Meshing in SOLIDWORKS SimulationSOLIDWORKS Simulation meshing: blended curvature-based mesher, density slider, mesh controls, draft vs high quality elements, aspect ratio, convergence.
- Your first static studyRun your first SOLIDWORKS static study: add-in, material, fixtures, loads, contacts, mesh and run, then check the deflection against beam theory.
- SOLIDWORKS FilletHow to use Fillet in SOLIDWORKS: constant, variable, face and full round fillets, profiles, tangent propagation, FilletXpert and why fillets fail.
- Thermal studiesRun a SOLIDWORKS Simulation thermal study: steady state vs transient, temperature, heat power, convection and radiation, thermal resistance, and thermal stress.